These statistics have been collated from a variety of different sources, which have differing ways of categorising and describing ‘race’ and ethnicity. (For example, some sources differentiate between particular black ‘groups’ whilst others do not. Some sources may just use the term Asian, others may differentiate between different Asian groups or different religious groups.) Where we have used other organisations’ statistics, we have followed the categorisation/names used by them – which means that there may be inconsistencies in terminology within and between pages.
Ethnicity
According to the Office for National Statistics, there were approximately 64.6 million people living in the UK in mid-2014. Of these, 56.2 million (87.2 per cent) were White British.
The most recent Census in 2011 highlights that in England and Wales, 80 per cent of the population were white British. Asian (Pakistani, Indian, Bangladeshi, other) ‘groups’ made up 6.8 per cent of the population; black groups 3.4 per cent; Chinese groups 0.7 cent,Arab groups 0.4 per cent and other groups 0.6 per cent.
In London in 2011, 45 per cent (3.7 million) of 8.2 million usual residents were White British.
87 per cent of those in England and Wales were born in the UK. Of those not born in the UK, 9 per cent were born in India, 8 per cent in Poland and 6 per cent in Pakistan.
The table below shows changes in the proportion (by percentage points) of the population of England and Wales, by ethnicity, between 2001 and 2011.
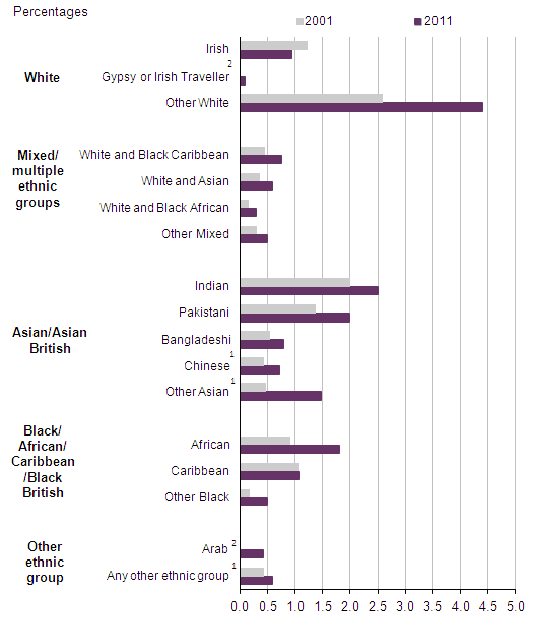
Notes:
- Comparability issues exist between these ethnic groups for the 2001 and 2011 Census
- No comparable data exists for these ethnic groups in 2001 Census
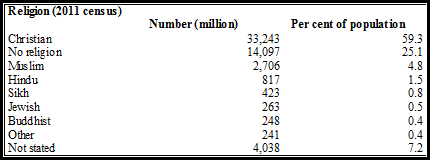
Religion
In the 2011 Census 59.5 per cent of the population of England and Wales identified as Christian. The second largest religious group was of Muslims (2.7 million people, 4.8 per cent of the population).